تم الحل ✓
categoryالرياضيات
schoolبكالوريوس
event_available2026-07-15
السؤال
Transcribed Image Text:
Problem Four:
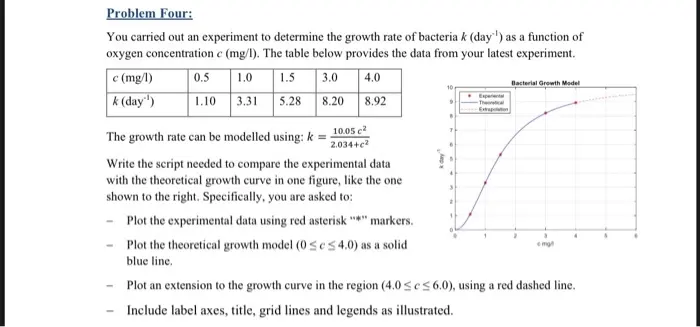
You carried out an experiment to determine the growth rate of bacteria k (day) as a function of
oxygen concentration c (mg/l). The table below provides the data from your latest experiment.
c (mg/l)
k (day)
0.5 1.0 1.5 3.0
4.0
1.10 3.31 5.28 8.20 8.92
10.05 c²
Bacterial Growth Model
The growth rate can be modelled using: k=; 2.034+c2
Write the script needed to compare the experimental data
with the theoretical growth curve in one figure, like the one
shown to the right. Specifically, you are asked to:
-
Plot the experimental data using red asterisk "*" markers.
Plot the theoretical growth model (0 ≤e≤ 4.0) as a solid
blue line.
omg
Plot an extension to the growth curve in the region (4.0c≤6.0), using a red dashed line.
Include label axes, title, grid lines and legends as illustrated.
check_circle الجواب — حل مفصل خطوة بخطوة
hourglass_top
🔒
الحل الكامل متاح للمشتركين
اشترك في أرشيف الأسئلة لعرض هذا الحل وآلاف الحلول المفصلة خطوة بخطوة من معلمين معتمدين.