تم الحل ✓
categoryأحياء
schoolبكالوريوس
event_available2026-07-13
السؤال
Transcribed Image Text:
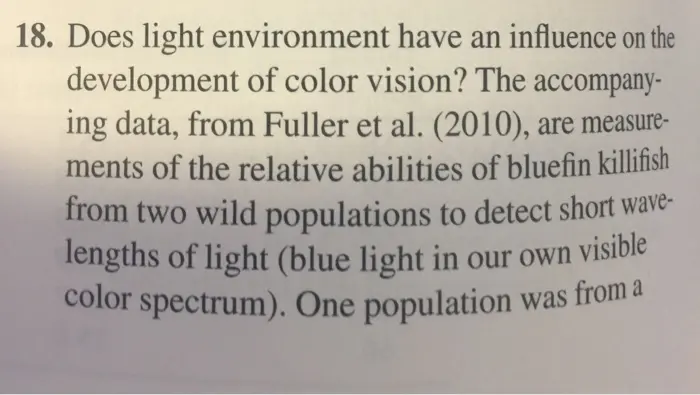
18. Does light environment have an influence on the
development of color vision? The accompany-
ing data, from Fuller et al. (2010), are measure-
ments of the relative abilities of bluefin killifish
from two wild populations to detect short wave-
lengths of light (blue light in our own visible
color spectrum). One population was from a
swamp, whose tea-stained water filters out blue
wavelengths, whereas the other population was
from a clear-water spring. Fish were crossed and
raised in the lab under two light conditions sim-
ulating those in the wild: clear and tea-stained.
Sensitivity to blue light was measured as the
relative expression of the SWSI opsin gene
in the eyes of the fish (as a proportion of total
expression of all opsins). Opsin proteins in eyes
detect light of specific wavelengths; SWS1 is
so named because it is shortwave sensitive. The
data are from a single individual from each of 33
families. Because the fish were raised in a com-
mon lab environment, population differences are
likely to be genetically based, whereas differ-
ences between fish under different water clarity
conditions are environmentally induced.
Population
Spring
Water
clarity
Clear
Swamp
Clear
Spring
Tea
Swamp
Tea
Relative
expression of SWS1
0.16, 0.11, 0.12, 0.11,
0.08, 0.09, 0.14, 0.16
0.08, 0.13, 0.07, 0.12,
0.12, 0.05, 0.06, 0.11
0.09, 0.09, 0.08, 0.10,
0.12, 0.06, 0.13, 0.08,
0.11, 0.07
0.06, 0.07, 0.08, 0.08,
0.10, 0.03, 0.03
a. How many factors are included in this exper-
iment? Identify them.
b. What type of experimental design was used?
c. Draw an interaction plot of the data (remem-
ber to show the data also).
d. Provide a word statement of a full linear
model to fit to the data.
e. Examine your graph from part (c), and
state which effects are likely to be present
in the results. Say how you reached your
conclusions. Explain whether the genetic
and enviromentally induced effects on SWSI
opsin expression appear to be in the same
direction.
f. The ANOVA results of the general linear
model analysis are shown in the table below.
What null hypotheses are tested?
g. Using this table, indicate which main effects
were found to be statistically significant. Do
the results agree with your assessment in
part (e) based on your graph?
TABLE FOR PROBLEM 18
Sum of
Mean
Source
squares
of
Population
0.00670
1
square
0.00670
F
P
8.98 0.006
Water
treatment
0.00647
1
0.00647
8.68 0.006
Population
water treatment
0.000000
1
Error
Total
0.03479
0.021619 29
32
0.000000
0.000745
0.00 0.999
check_circle الجواب — حل مفصل خطوة بخطوة
hourglass_top
🔒
الحل الكامل متاح للمشتركين
اشترك في أرشيف الأسئلة لعرض هذا الحل وآلاف الحلول المفصلة خطوة بخطوة من معلمين معتمدين.