تم الحل ✓
categoryالرياضيات
schoolبكالوريوس
event_available2026-07-15
السؤال
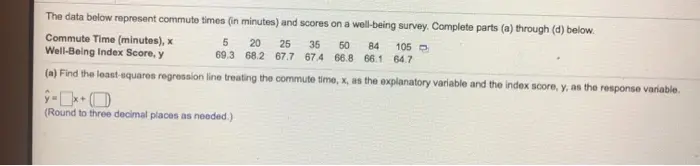
Transcribed Image Text:
The data below represent commute times (in minutes) and scores on a well-being survey. Complete parts (a) through (d) below.
Commute Time (minutes), x
Well-Being Index Score, y
50 84 105
5 20 25 35
69.3 68.2 67.7 67.4 66.8 66.1 64.7
(a) Find the least-squares regression line treating the commute time, x, as the explanatory variable and the index score, y, as the response variable.
00-6
(Round to three decimal places as needed.)
check_circle الجواب — حل مفصل خطوة بخطوة
hourglass_top
🔒
الحل الكامل متاح للمشتركين
اشترك في أرشيف الأسئلة لعرض هذا الحل وآلاف الحلول المفصلة خطوة بخطوة من معلمين معتمدين.