تم الحل ✓
categoryإحصاء
schoolبكالوريوس
event_available2026-07-15
السؤال
Transcribed Image Text:
Construct and understand box-and-whisker plots
Question
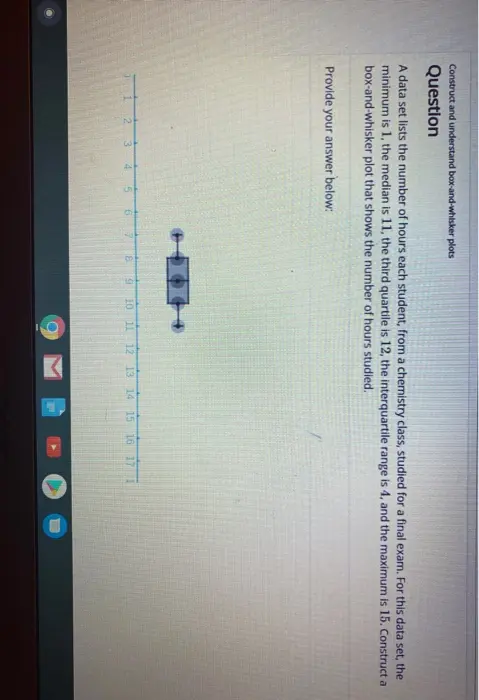
A data set lists the number of hours each student, from a chemistry class, studied for a final exam. For this data set, the
minimum is 1, the median is 11, the third quartile is 12, the interquartile range is 4, and the maximum is 15. Construct a
box-and-whisker plot that shows the number of hours studied.
Provide your answer below:
12
4
6
7 8 9 10 11 12 13 14 15 16 17
check_circle الجواب — حل مفصل خطوة بخطوة
hourglass_top
🔒
الحل الكامل متاح للمشتركين
اشترك في أرشيف الأسئلة لعرض هذا الحل وآلاف الحلول المفصلة خطوة بخطوة من معلمين معتمدين.