تم الحل ✓
categoryهندسة كهربائية
schoolبكالوريوس
event_available2026-07-15
السؤال
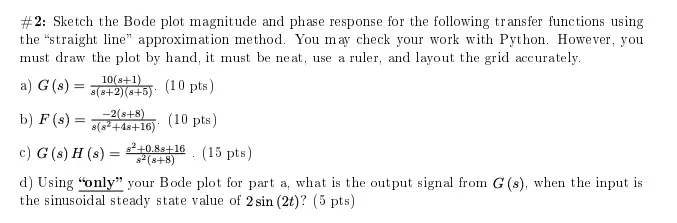
Transcribed Image Text:
#2: Sketch the Bode plot magnitude and phase response for the following transfer functions using
the "straight line" approximation method. You may check your work with Python. However, you
must draw the plot by hand, it must be neat, use a ruler, and layout the grid accurately.
10(s+1)
8(8+2)(8+5)
a) G(s) =
(10 pts)
b) F(s) =
-2(8+8)
8(8²+48+16)
(10 pts)
c) G (s) H (s) =
82+0.88+16
82(8+8)
(15 pts)
d) Using "only" your Bode plot for part a, what is the output signal from G (s), when the input is
the sinusoidal steady state value of 2 sin (2t)? (5 pts)
check_circle الجواب — حل مفصل خطوة بخطوة
hourglass_top
🔒
الحل الكامل متاح للمشتركين
اشترك في أرشيف الأسئلة لعرض هذا الحل وآلاف الحلول المفصلة خطوة بخطوة من معلمين معتمدين.