تم الحل ✓
categoryهندسة صناعية وإنتاج
schoolبكالوريوس
event_available2026-07-13
السؤال
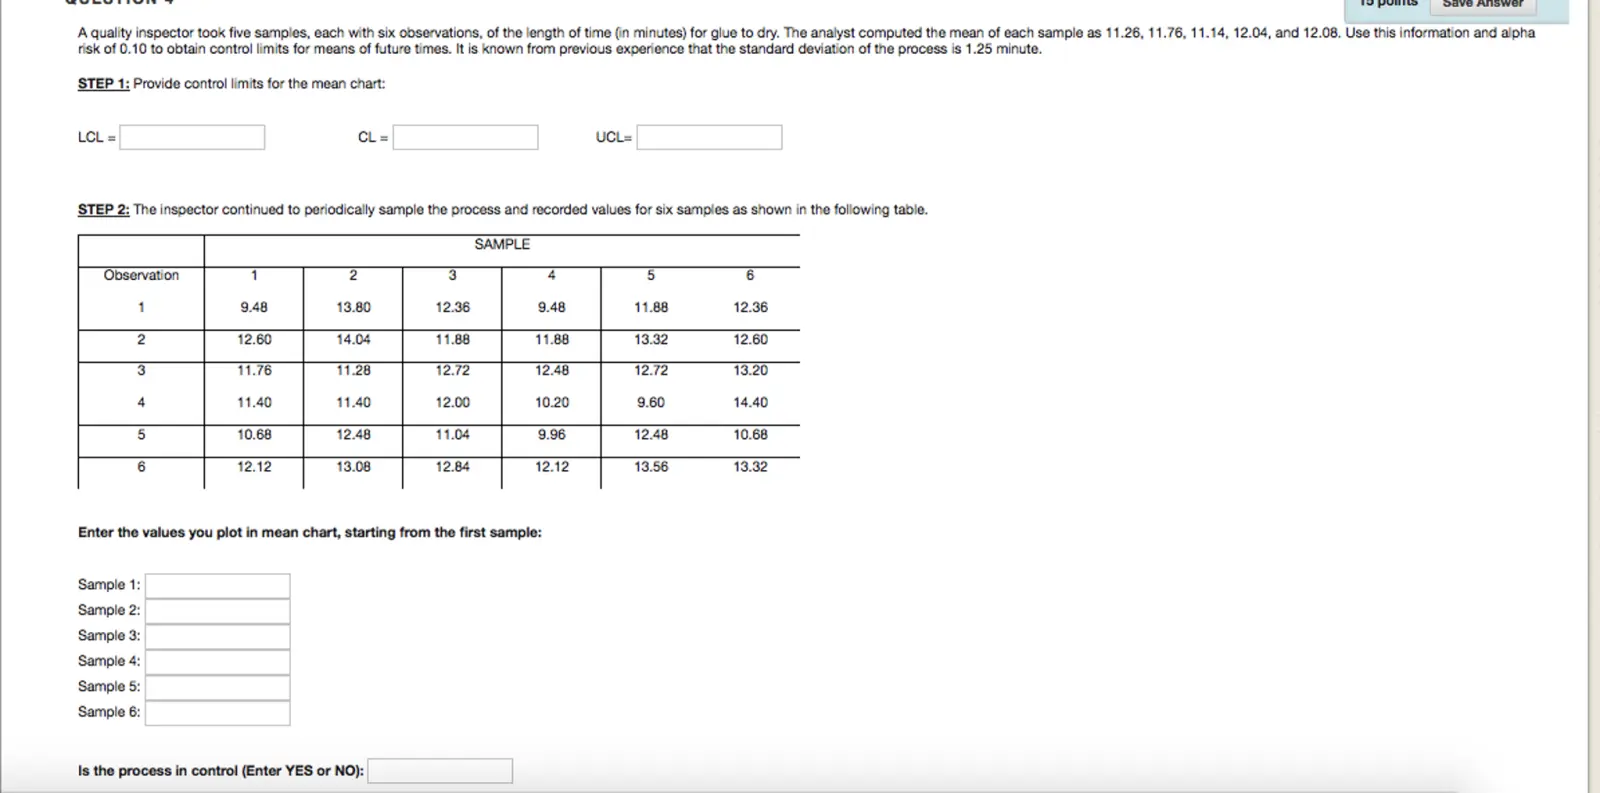
Transcribed Image Text:
Save Answer
A quality inspector took five samples, each with six observations, of the length of time (in minutes) for glue to dry. The analyst computed the mean of each sample as 11.26, 11.76, 11.14, 12.04, and 12.08. Use this information and alpha
risk of 0.10 to obtain control limits for means of future times. It is known from previous experience that the standard deviation of the process is 1.25 minute.
STEP 1: Provide control limits for the mean chart:
LCL=
CL=
UCL=
STEP 2: The inspector continued to periodically sample the process and recorded values for six samples as shown in the following table.
SAMPLE
Observation
1
2
3
4
5
6
1
9.48
13.80
12.36
9.48
11.88
12.36
2
12.60
14.04
11.88
11.88
13.32
12.60
3
11.76
11.28
12.72
12.48
12.72
13.20
4
11.40
11.40
12.00
10.20
9.60
14.40
5
10.68
12.48
11.04
9.96
12.48
10.68
6
12.12
13.08
12.84
12.12
13.56
13.32
Enter the values you plot in mean chart, starting from the first sample:
Sample 1:
Sample 2:
Sample 3:
Sample 4:
Sample 5:
Sample 6:
Is the process in control (Enter YES or NO):
check_circle الجواب — حل مفصل خطوة بخطوة
hourglass_top
🔒
الحل الكامل متاح للمشتركين
اشترك في أرشيف الأسئلة لعرض هذا الحل وآلاف الحلول المفصلة خطوة بخطوة من معلمين معتمدين.