تم الحل ✓
categoryالرياضيات
schoolبكالوريوس
event_available2026-07-15
السؤال
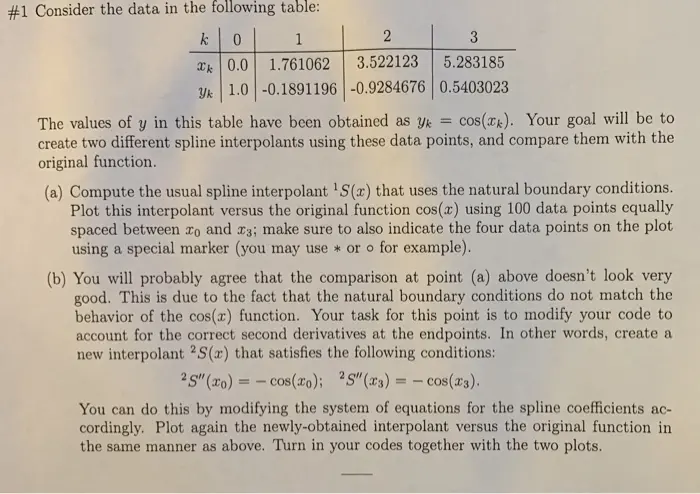
Transcribed Image Text:
#1 Consider the data in the following table:
k
0
1
2
3
Tk 0.0
1.761062
3.522123 5.283185
Yk 1.0 -0.1891196 -0.9284676 0.5403023
The values of y in this table have been obtained as yk = cos(x). Your goal will be to
create two different spline interpolants using these data points, and compare them with the
original function.
(a) Compute the usual spline interpolant 'S(x) that uses the natural boundary conditions.
Plot this interpolant versus the original function cos(x) using 100 data points equally
spaced between 20 and 23; make sure to also indicate the four data points on the plot
using a special marker (you may use or o for example).
(b) You will probably agree that the comparison at point (a) above doesn't look very
good. This is due to the fact that the natural boundary conditions do not match the
behavior of the cos(x) function. Your task for this point is to modify your code to
account for the correct second derivatives at the endpoints. In other words, create a
new interpolant 2S(x) that satisfies the following conditions:
2S" (xo) = cos(xo); 2S" (x3)= cos(x3).
You can do this by modifying the system of equations for the spline coefficients ac-
cordingly. Plot again the newly-obtained interpolant versus the original function in
the same manner as above. Turn in your codes together with the two plots.
check_circle الجواب — حل مفصل خطوة بخطوة
hourglass_top
🔒
الحل الكامل متاح للمشتركين
اشترك في أرشيف الأسئلة لعرض هذا الحل وآلاف الحلول المفصلة خطوة بخطوة من معلمين معتمدين.