تم الحل ✓
categoryهندسة صناعية وإنتاج
schoolبكالوريوس
event_available2026-07-15
السؤال
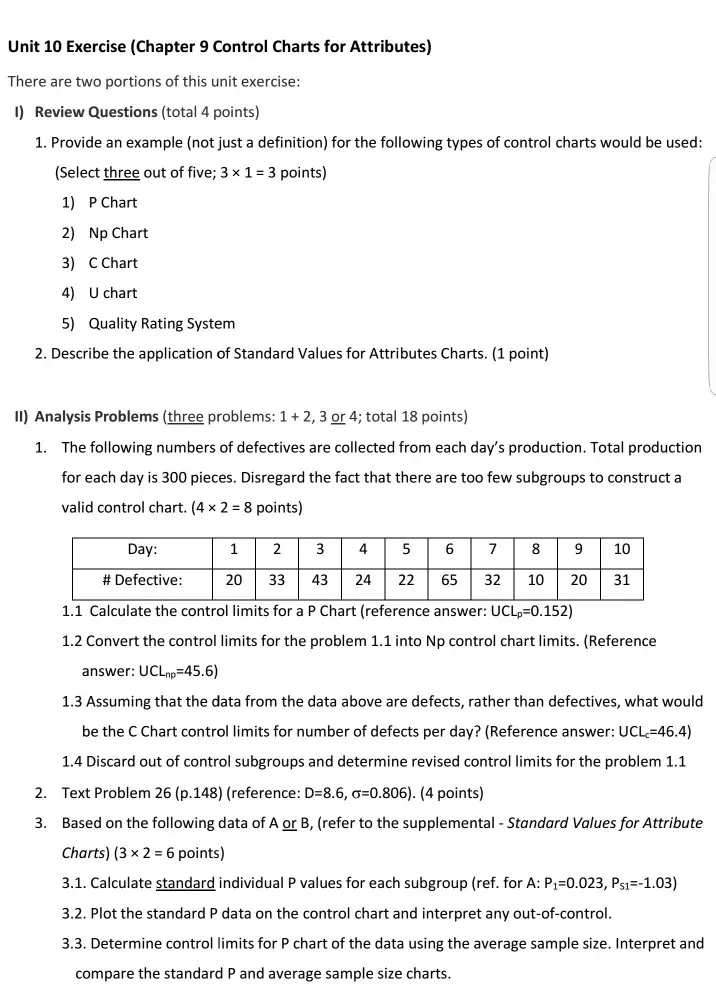
Transcribed Image Text:
Unit 10 Exercise (Chapter 9 Control Charts for Attributes)
There are two portions of this unit exercise:
I) Review Questions (total 4 points)
1. Provide an example (not just a definition) for the following types of control charts would be used:
(Select three out of five; 3 × 1 = 3 points)
1) P Chart
2) Np Chart
3) C Chart
4) U chart
5) Quality Rating System
2. Describe the application of Standard Values for Attributes Charts. (1 point)
II) Analysis Problems (three problems: 1 + 2, 3 or 4; total 18 points)
1. The following numbers of defectives are collected from each day's production. Total production
for each day is 300 pieces. Disregard the fact that there are too few subgroups to construct a
valid control chart. (4 x 2 = 8 points)
Day:
# Defective:
1 2 3
45678910
20 33 43
24 22 65 32 10 20 31
1.1 Calculate the control limits for a P Chart (reference answer: UCLp=0.152)
1.2 Convert the control limits for the problem 1.1 into Np control chart limits. (Reference
answer: UCL np=45.6)
1.3 Assuming that the data from the data above are defects, rather than defectives, what would
be the C Chart control limits for number of defects per day? (Reference answer: UCL.=46.4)
1.4 Discard out of control subgroups and determine revised control limits for the problem 1.1
2. Text Problem 26 (p.148) (reference: D=8.6, σ=0.806). (4 points)
3. Based on the following data of A or B, (refer to the supplemental - Standard Values for Attribute
Charts) (3 × 2 = 6 points)
3.1. Calculate standard individual P values for each subgroup (ref. for A: P₁=0.023, Ps1=-1.03)
3.2. Plot the standard P data on the control chart and interpret any out-of-control.
3.3. Determine control limits for P chart of the data using the average sample size. Interpret and
compare the standard P and average sample size charts.
Problem A
Problem B
Subgroup
n Np
Subgroup n
Np
1
1753 41
41
1
157 3
2
1772 56
2
206 4
3
1698 50
3
139
2
4
1800 62
4
251
5
5
1654 39
5
196
5
6
1275 29
6
271
1
7
1161 62
7
128 2
8
1976 21
8
107
6
9
1421 40
9
280
4
10
1750 40
10
236
5
4. Based on the text Table 9-6 (p.139) (3 × 2 = 6 points)
e:
4.1 Construct a standard U chart of the data (Reference answer: Us1=-1.05)
4.2 Compare this standard chart with Figure 9-13. (The calculation of Subgroup #1 is provided in
the example in the supplemental instruction.)
4.3. Determine control limits for a U chart of the data using the average sample size. Interpret
and compare the standard u chart and average sample size charts. (Reference answer:
UCLU=1.54)
.
Detailed calculation is required as the answers are provided - Zero point if no calculation.
. You are not required to submit every problem, considering workload/time. However, you
should know how to do all the problems to make sure you have good understanding on
them as they are in the scope of final exam.
•
If you choose to do all the problems, your grade is based on the better one(s) of the
problems.
and a keg of nails. The inspected unit can be any size that
meets the objective; however, it must be constant. Recall that
the subgroup size, n, is not in the calculations because its
value is 1. When situations arise where the subgroup size var-
ies, then the u chart (count of nonconformities/unit) is the
appropriate chart. The u chart can also be used when the sub-
group size is constant.
The u chart is mathematically equivalent to the c chart. It
is developed in the same manner as the c chart, with the col-
lection of 25 subgroups, calculation of trial central line and
control limits, acquisition of an estimate of the standard or
reference count of nonconformities per unit, and calculation
of the revised limits. Formulas used for the procedure are
= n
"
u =
Σε
Ση
UCL +3.
LCL 3
п
n
Control Charts for Attributes
where c = count of nonconformities in a subgroup
n = number inspected in a subgroup
139
u = count of nonconformities/unit in a subgroup
= average count of nonconformities/unit for many
subgroups
Revised control limits are obtained by substituting in the
trial control limit formula. The u chart will be illustrated by
an example.
Each day a clerk inspects the waybills of a small over-
night air freight company for errors. Because the number of
waybills varies from day to day, a u chart is the appropriate
technique. If the number of waybills was constant, either the
c or u chart would be appropriate. Data are collected as
shown in Table 9-6. The date, number inspected, and count
of nonconformities are obtained and posted to the table.
The count of nonconformities per unit, u, is calculated and
posted. Also, because the subgroup size varies, the control
limits are calculated for each subgroup.
Number
Inspected
TABLE 9-6 Count of Nonconformities per Unit for Waybills
Nonconformities
per unit
Count of
Nonconformities
Date
n
с
u
UCL
LCL
Jan. 30
110
120
1.09
1.51
0.89
31
82
94
1.15
1.56
0.84
Feb. 1
96
89
.93
1.53
0.87
Mar. 1
2346789DURART8222222227234
115
162
1.41
1.50
0.90
108
150
1.39
1.51
0.89
56
82
1.46
1.64
0.76
120
143
1.19
1.50
0.90
98
134
1.37
1.53
0.87
102
97
.95
1.53
0.87
115
145
1.26
1.50
0.90
10
88
128
1.45
1.55
0.85
11
71
83
1.16
1.59
0.81
13
95
120
1.26
1.54
0.86
14
103
116
1.13
1.52
0.88
15
113
127
1.12
1.51
0.89
16
85
92
1.08
1.56
0.841
17
101
140
1.39
1.53
0.87
18
42
60
1.19
1.70
0.70
20
97
121
1.25
1.53
0.87
21
92
108
1.17
1.54
0.86
100
131
1.31
1.53
0.87
115
119
1.03
1.50
0.90
99
93
.94
1.53
0.87
25
57
88
1.54
1.64
0.76
89
107
1.20
1.55
0.85
101
105
1.04
1.53
0.87
122
143
1.17
1.49
0.91
105
132
1.26
1.52
0.88
98
100
1.02
1.53
0.87
48
60
1.25
1.67
0.73
Total 2823
3389
check_circle الجواب — حل مفصل خطوة بخطوة
hourglass_top
🔒
الحل الكامل متاح للمشتركين
اشترك في أرشيف الأسئلة لعرض هذا الحل وآلاف الحلول المفصلة خطوة بخطوة من معلمين معتمدين.