تم الحل ✓
categoryرياضيات
schoolبكالوريوس
event_available2026-07-15
السؤال
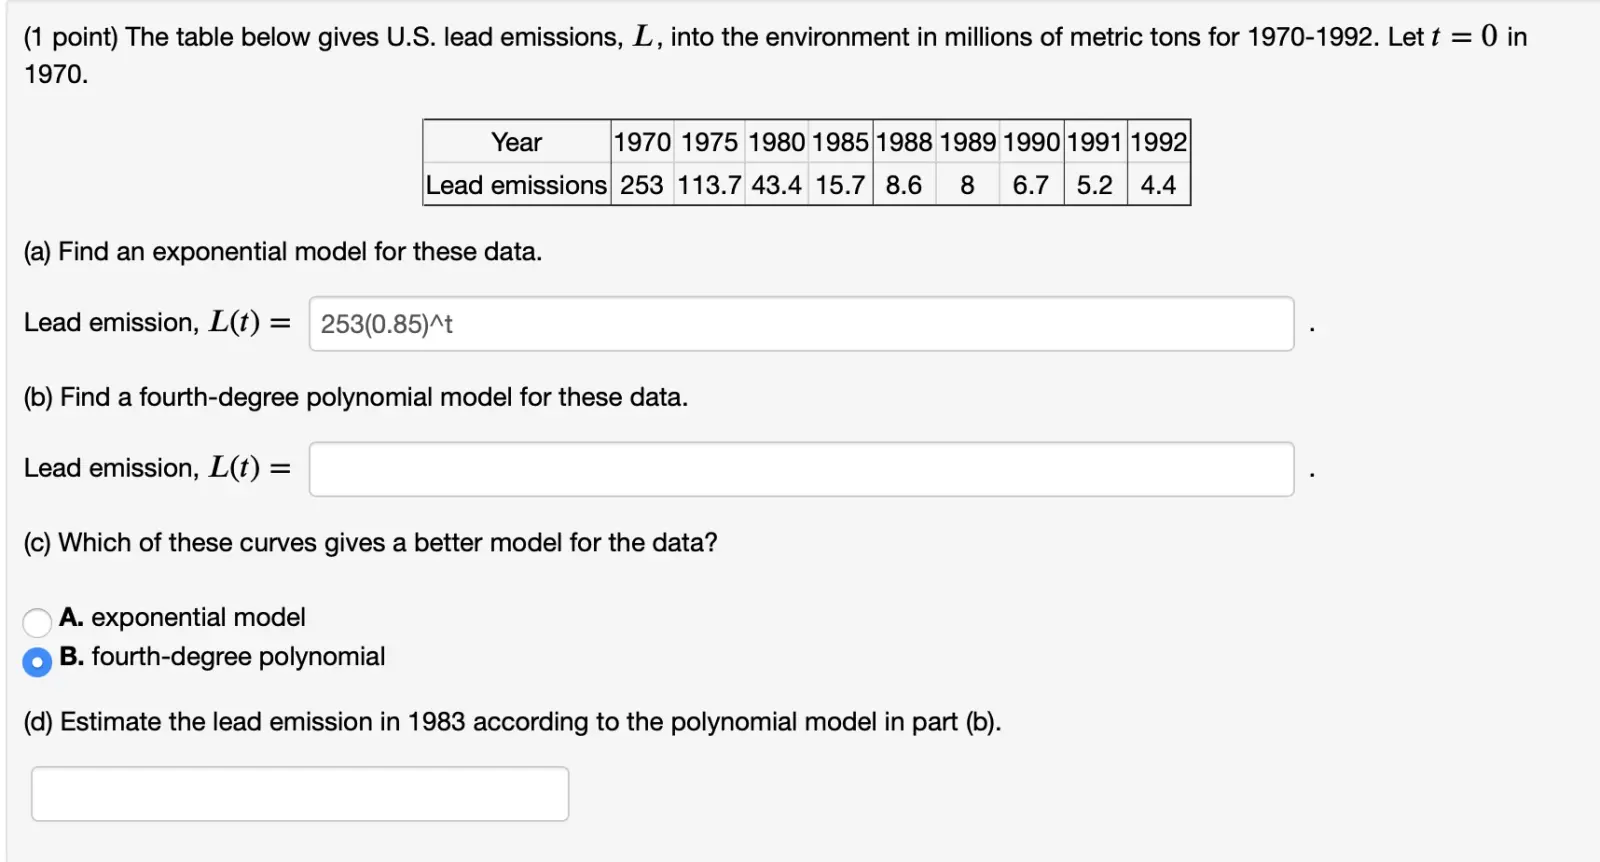
Transcribed Image Text:
(1 point) The table below gives U.S. lead emissions, L, into the environment in millions of metric tons for 1970-1992. Let t = 0 in
1970.
Year
1970 1975 1980 1985 1988 1989 1990 1991 1992
Lead emissions 253 113.7 43.4 15.7 8.6
6 8 6 6.7 5.2 4.4
(a) Find an exponential model for these data.
Lead emission, L(t) = 253(0.85)^t
(b) Find a fourth-degree polynomial model for these data.
Lead emission, L(t) =
(c) Which of these curves gives a better model for the data?
A. exponential model
B. fourth-degree polynomial
(d) Estimate the lead emission in 1983 according to the polynomial model in part (b).
check_circle الجواب — حل مفصل خطوة بخطوة
hourglass_top
🔒
الحل الكامل متاح للمشتركين
اشترك في أرشيف الأسئلة لعرض هذا الحل وآلاف الحلول المفصلة خطوة بخطوة من معلمين معتمدين.