تم الحل ✓
categoryتحليل البيانات وعلم البيانات
schoolبكالوريوس
event_available2026-07-15
السؤال
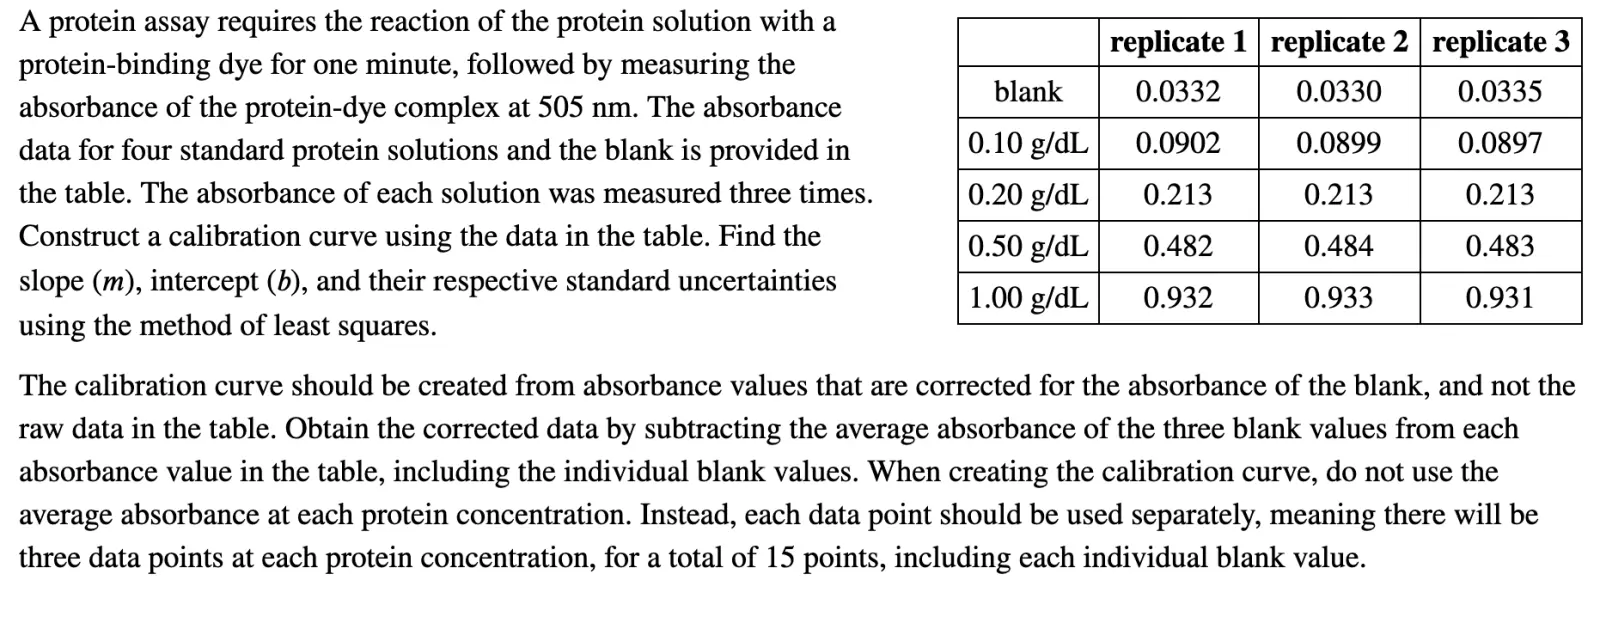
Transcribed Image Text:
A protein assay requires the reaction of the protein solution with a
protein-binding dye for one minute, followed by measuring the
absorbance of the protein-dye complex at 505 nm. The absorbance
data for four standard protein solutions and the blank is provided in
the table. The absorbance of each solution was measured three times.
Construct a calibration curve using the data in the table. Find the
slope (m), intercept (b), and their respective standard uncertainties
using the method of least squares.
replicate 1 replicate 2 replicate 3
blank
0.0332
0.0330
0.0335
0.10 g/dL
0.0902
0.0899
0.0897
0.20 g/dL
0.213
0.213
0.213
0.50 g/dL
0.482
0.484
0.483
1.00 g/dL
0.932
0.933
0.931
The calibration curve should be created from absorbance values that are corrected for the absorbance of the blank, and not the
raw data in the table. Obtain the corrected data by subtracting the average absorbance of the three blank values from each
absorbance value in the table, including the individual blank values. When creating the calibration curve, do not use the
average absorbance at each protein concentration. Instead, each data point should be used separately, meaning there will be
three data points at each protein concentration, for a total of 15 points, including each individual blank value.
check_circle الجواب — حل مفصل خطوة بخطوة
hourglass_top
🔒
الحل الكامل متاح للمشتركين
اشترك في أرشيف الأسئلة لعرض هذا الحل وآلاف الحلول المفصلة خطوة بخطوة من معلمين معتمدين.