تم الحل ✓
categoryالهندسة الكهربائية
schoolبكالوريوس
event_available2026-07-15
السؤال
Transcribed Image Text:
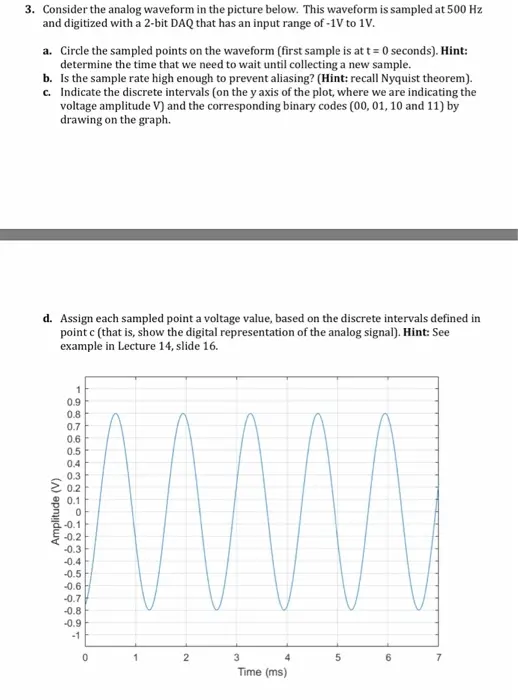
3. Consider the analog waveform in the picture below. This waveform is sampled at 500 Hz
and digitized with a 2-bit DAQ that has an input range of -1V to 1V.
a. Circle the sampled points on the waveform (first sample is at t=0 seconds). Hint:
determine the time that we need to wait until collecting a new sample.
b. Is the sample rate high enough to prevent aliasing? (Hint: recall Nyquist theorem).
c. Indicate the discrete intervals (on the y axis of the plot, where we are indicating the
voltage amplitude V) and the corresponding binary codes (00, 01, 10 and 11) by
drawing on the graph.
d. Assign each sampled point a voltage value, based on the discrete intervals defined in
point c (that is, show the digital representation of the analog signal). Hint: See
example in Lecture 14, slide 16.
Amplitude (V)
0.9
0.8
0.7
0.6
198665
0.5
0.4
0.3
0.2
0.1
0
-0.11
-0.2
-0.3
-0.4
-0.5
-0.6
-0.7
-0.8
-0.9
-1
0
1
2
3
4
5
Time (ms)
16
7
check_circle الجواب — حل مفصل خطوة بخطوة
hourglass_top
🔒
الحل الكامل متاح للمشتركين
اشترك في أرشيف الأسئلة لعرض هذا الحل وآلاف الحلول المفصلة خطوة بخطوة من معلمين معتمدين.