تم الحل ✓
categoryإحصاء
schoolبكالوريوس
event_available2026-07-15
السؤال
Transcribed Image Text:
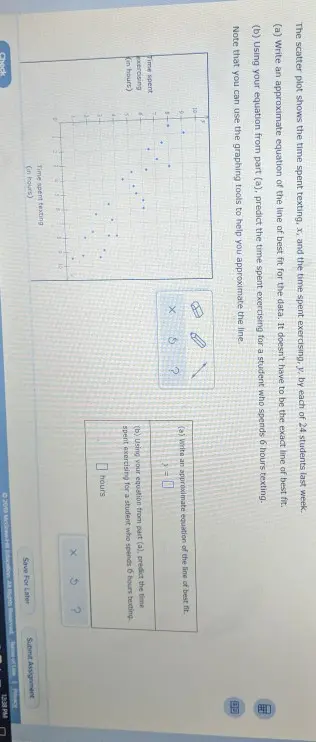
The scatter plot shows the time spent texting, x, and the time spent exercising, y, by each of 24 students last week.
(a) Write an approximate equation of the line of best fit for the data. It doesn't have to be the exact line of best fit.
(b) Using your equation from part (a), predict the time spent exercising for a student who spends 6 hours texting.
Note that you can use the graphing tools to help you approximate the line.
Time spent
exercising
Kin hours)
Check
10-
4
Time spent texting
(in hours)
×
G
?
(a) Write an approximate equation of the line of best fit.
(b) Using your equation from part (a), predict the time
spent exercising for a student who spends 6 hours texting
hours
Save For Later
Submit Assignment
© 2018 McGraw-H
Rights Reserved
Tarms of Lion & Pacy
12:38 PM
check_circle الجواب — حل مفصل خطوة بخطوة
hourglass_top
🔒
الحل الكامل متاح للمشتركين
اشترك في أرشيف الأسئلة لعرض هذا الحل وآلاف الحلول المفصلة خطوة بخطوة من معلمين معتمدين.