تم الحل ✓
categoryالهندسة الميكانيكية
schoolبكالوريوس
event_available2026-07-15
السؤال
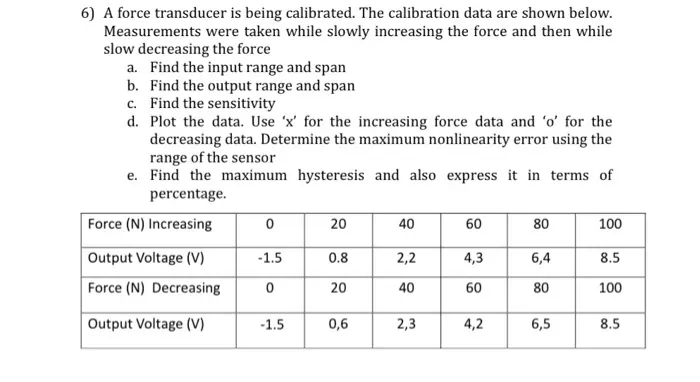
Transcribed Image Text:
6) A force transducer is being calibrated. The calibration data are shown below.
Measurements were taken while slowly increasing the force and then while
slow decreasing the force
a. Find the input range and span
b. Find the output range and span
c. Find the sensitivity
d. Plot the data. Use 'x' for the increasing force data and 'o' for the
decreasing data. Determine the maximum nonlinearity error using the
range of the sensor
e. Find the maximum hysteresis and also express it in terms of
percentage.
Force (N) Increasing
0
20
40
60
80
100
Output Voltage (V)
-1.5
0.8
2,2
4,3
6,4
8.5
Force (N) Decreasing
0
20
40
60
80
100
Output Voltage (V)
-1.5
0,6
2,3
4,2
6,5
8.5
check_circle الجواب — حل مفصل خطوة بخطوة
hourglass_top
🔒
الحل الكامل متاح للمشتركين
اشترك في أرشيف الأسئلة لعرض هذا الحل وآلاف الحلول المفصلة خطوة بخطوة من معلمين معتمدين.