تم الحل ✓
categoryإحصاء
schoolبكالوريوس
event_available2026-07-15
السؤال
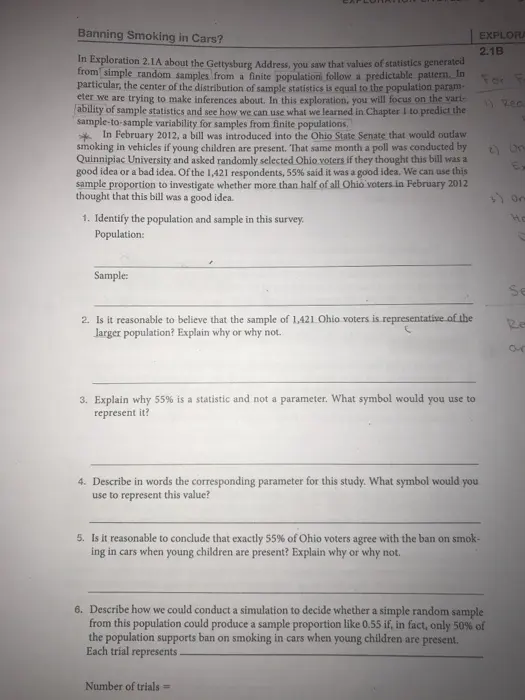
Transcribed Image Text:
Banning Smoking in Cars?
In Exploration 2.1A about the Gettysburg Address, you saw that values of statistics generated
from simple random samples from a finite population follow a predictable pattern. In
particular, the center of the distribution of sample statistics is equal to the population param-
eter we are trying to make inferences about. In this exploration, you will focus on the vari
ability of sample statistics and see how we can use what we learned in Chapter 1 to predict the
sample-to-sample variability for samples from finite populations.
In February 2012, a bill was introduced into the Ohio State Senate that would outlaw
smoking in vehicles if young children are present. That same month a poll was conducted by
Quinnipiac University and asked randomly selected Ohio voters if they thought this bill was a
good idea or a bad idea. Of the 1,421 respondents, 55% said it was a good idea. We can use this
sample proportion to investigate whether more than half of all Ohio voters in February 2012
thought that this bill was a good idea.
1. Identify the population and sample in this survey.
Population:
EXPLORA
2.18
For F
1) Rea
2) On
EX
3) On
Ho
Sample:
Se
2. Is it reasonable to believe that the sample of 1,421 Ohio voters is representative of the
larger population? Explain why or why not.
Re
3. Explain why 55% is a statistic and not a parameter. What symbol would you use to
represent it?
4. Describe in words the corresponding parameter for this study. What symbol would you
use to represent this value?
5. Is it reasonable to conclude that exactly 55% of Ohio voters agree with the ban on smok-
ing in cars when young children are present? Explain why or why not.
6. Describe how we could conduct a simulation to decide whether a simple random sample
from this population could produce a sample proportion like 0.55 if, in fact, only 50% of
the population supports ban on smoking in cars when young children are present.
Each trial represents.
Number of trials =
Homework 10-15
CHAPTER 2 Generalization: How Broadly Do the Results Apply?
7. Some estimates suggest that there are approximately 7.8 million registered voters in Ohio.
Suppose 50% of Ohio voters are in favor of this ban. If this is true, what is the probability
that a randomly selected voter will be in favor of the ban?
8. If 50% of Ohio voters are in favor of the ban, how many people is this? Report your
answer in millions.
9. Suppose I select an Ohio voter from the set of all 7.8 million voters and that voter is in
favor of the ban. What is the probability that the next randomly selected voter will also be
in favor of the ban?
Your answer to the previous question suggests that when we are sampling from a finite
population, without replacement, we technically don't have a constant probability of success
like we assumed in Chapter 1. However, if the population size is much much larger than the
sample size, then we can treat the probability of success as roughly constant. In other words,
we will assume samples from a very large population behave just like samples from an infinite
process.
KEY IDEA
(New Information)
When sampling from a large population, the standard deviation of sample proportions
is estimated by the same formula, Ja(1-x)/n, where a represents the proportion
of successes in the population and n represents the sample size since samples from
very large populations behave like samples from an infinite process. The population is
considered large enough when it is more than 20 times that sample size.
This means that the inference methods that you learned in Chapter 1, both simulation-based
and theory-based, can be applied to a random sample from a population. In such situations the
parameter of interest is the population proportion with the characteristic, rather than the long-
run process probability of success. (The population proportion and process probability can be
considered to be equivalent if you think of the process as randomly selecting an observational
unit from the population.)
10. Use the One Proportion applet to estimate a p-value for testing whether more than 50%
of Ohio voters are in favor of the ban for this survey. Begin by stating the null and alterna-
tive hypotheses. Be clear how many "coin tosses" you use and how many repetitions you
use. Report the p-value you obtain.
EXPLORATION 2.10: Banning Smoking in Cars?
49
11. Write a one-sentence interpretation of your p-value and summarize the strength of
evidence against the null hypothesis provided by this p-value.
12. Report the standard deviation of the null distribution displayed by the applet. How does
this compare to the formula for the standard deviation of a sample proportion discussed
in Chapter 1 (√(1-x)/n) when x=0.50?
VALIDITY CONDITIONS
The normal approximation can be used to model the null distribution of the sample
proportion for random samples from a finite population when the population size is
more than 20 times the size of the sample and if there are at least 10 successes and
at least 10 failures in the sample.
13. Are the validity conditions met for using a theory-based method to predict a p-value
from this sample? Why or why not?
14. Check the box for Normal Approximation in the applet. Report and interpret the value
of the standardized statistic.
15. Is the theory-based estimate of the p-value similar to the p-value from the simula-
tion-based method?
check_circle الجواب — حل مفصل خطوة بخطوة
hourglass_top
🔒
الحل الكامل متاح للمشتركين
اشترك في أرشيف الأسئلة لعرض هذا الحل وآلاف الحلول المفصلة خطوة بخطوة من معلمين معتمدين.