تم الحل ✓
categoryرياضيات
schoolبكالوريوس
event_available2026-07-15
السؤال
Transcribed Image Text:
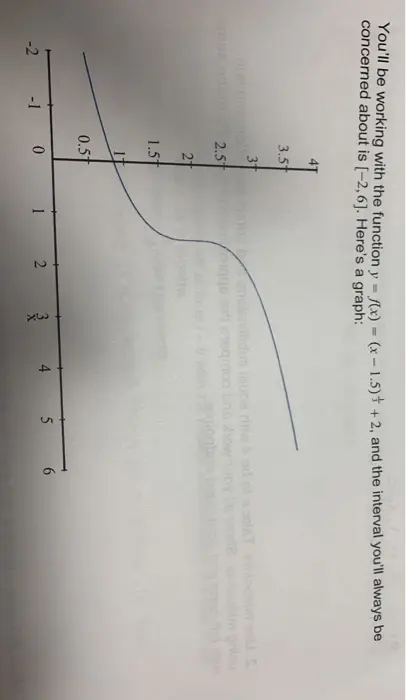
You'll be working with the function y = f(x) = (x-1.5)+ +2, and the interval you'll always be
concerned about is [-2,6]. Here's a graph:
3.5
3
amua namis 2.5
dua isupa riliw kod of noxaT aloobin saU S
bra how quoy
loqbim pnieu
2
1.5
0.5
-2
-1
0
2
3x
4
5 6
bdue leupe aist of povert
belahden ad fnob lud
You'll need to have the graph (above) on paper, so you'll need to print it or draw it on paper.
You'll need at least three copies. I'll call them your "paper graphs."
The actual area under the curve on the interval [-2,6] is about 17.586.
Approximating the area under the curve on the interval [-2,6] by using a Riemann sum with
4 equal subdivisions and left-hand endpoints gives you
--
R = 2(-2)+(0) + (2) +ƒ(4))
=
14.976. Draw the rectangles used for this Riemann sum
on one of your paper graphs. Do you see where the error for this approximation is?
Approximating the area under the curve on the interval [-2,6] by using a Riemann sum with
4 equal subdivisions and right-hand endpoints gives you
R 2((0)+(2) +ƒ(4) +ƒ(6))
=
21.314. Draw the rectangles used for this Riemann sum on
one of your paper graphs. Do you see where the error for this approximation is?
msw loeb up
Now, you'll try to improve these approximations. (Remember, the interval you're always
working with is [-2,6].)
1. Re-compute the Riemann sum, but this time increase the number of subdivisions. Take n
to be at least 8 (with equal subdivisions) and compute a Riemann sum using either
left-hand endpoints or right-hand endpoints. Show all your computation work and compare
the approximation to the Riemann sum using only 4 subdivisions and the same endpoint
scheme. (Note: You don't need to show function evaluations, so it's okay to write, for
example, f(12)+(13)+(14)= [answer], and let your calculator compute the answer, as
long as it's correct.)
2. Use midpoints. Taken to be 4 with equal subdivisions and compute a Riemann sum
using midpoints. Show all your work and compare the approximation to the Riemann sums
with left-hand and right-hand endpoints.
3. Now, still taken to be 4, but don't be restricted by having to take equal subdivisions. You
should use one of your paper graphs to try to draw the 4 best rectangles to approximate the
area under the curve. Then add up the areas of the rectangles and what do you get? Show
all your work, indicating where you placed your subintervals and how you arrived at the
heights of the rectangles. Include your graph. How does the approximation compare with
the others you've made?
Sai nouemixo
fliw mus nnsme P
no mus nomm
level er no evi
uoy aevig elniogbne bin frel bris an
loveini
A
eno
4. Finally, devise a way to improve the approximation of area under this curve, still taking
only 4 subdivisions. (Hint: You don't need to use rectangles if you don't want to.) Explain
your method and calculations. Is your approximation any better than the previous ones? Do
you think your method will work well in general, for example, for a general curve? There is
no one correct answer here. The important thing is that you come up with an alternative
idea and that you explain how it works and why it works better than a Riemann sum.
erlt ossaioni omil airu fud,ve nemoi srl stugmoo-st
dua lepe rifiw) & teas! is od of
check_circle الجواب — حل مفصل خطوة بخطوة
hourglass_top
🔒
الحل الكامل متاح للمشتركين
اشترك في أرشيف الأسئلة لعرض هذا الحل وآلاف الحلول المفصلة خطوة بخطوة من معلمين معتمدين.