تم الحل ✓
categoryالفيزياء
schoolبكالوريوس
event_available2026-07-15
السؤال
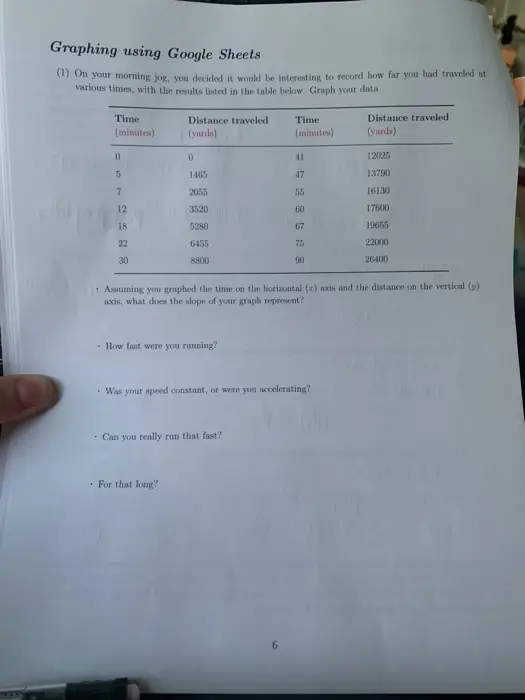
Transcribed Image Text:
Graphing using Google Sheets
(1) On your morning jog, you decided it would be interesting to record how far you had traveled at
various times, with the results listed in the table below. Graph your data
Time
(minutes)
0
Distance traveled
(yards)
Time
(minutes)
Distance traveled
(yards)
0
5
1465
7
2055
12
3520
18
5280
22
6455
30
8800
=286128
41
12025
47
13790
55
16130
60
17600
67
19655
75
22000
90
26400
Assuming you graphed the time on the horizontal (r) axis and the distance on the vertical (y)
axis, what does the slope of your graph represent?
How fast were you running?
Was your speed constant, or were you accelerating?
Can you really run that fast?
For that long?
check_circle الجواب — حل مفصل خطوة بخطوة
hourglass_top
🔒
الحل الكامل متاح للمشتركين
اشترك في أرشيف الأسئلة لعرض هذا الحل وآلاف الحلول المفصلة خطوة بخطوة من معلمين معتمدين.