تم الحل ✓
categoryالبيئة والاستدامة
schoolبكالوريوس
event_available2026-07-14
السؤال
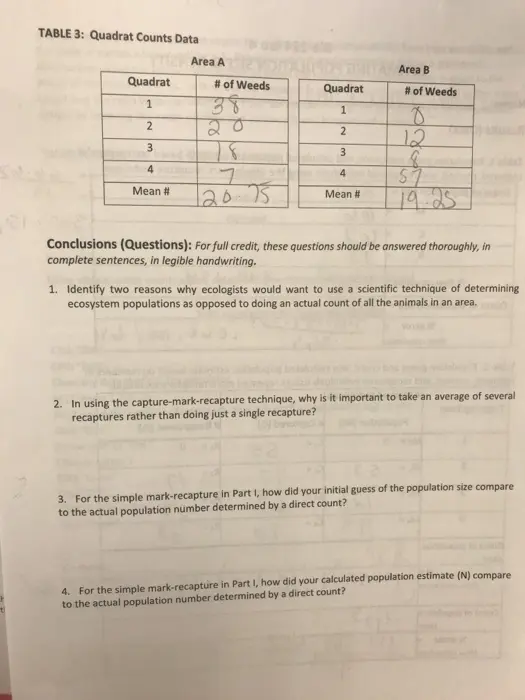
Transcribed Image Text:
TABLE 3: Quadrat Counts Data
Area A
TAJUS
Area B
Quadrat
# of Weeds
Quadrat
# of Weeds
1
38
1
0
2
20
2
12
3
3
8
4
7
4
51
Mean #
20.75
Mean #
19.25
Conclusions (Questions): For full credit, these questions should be answered thoroughly, in
complete sentences, in legible handwriting.
1. Identify two reasons why ecologists would want to use a scientific technique of determining
ecosystem populations as opposed to doing an actual count of all the animals in an area.
2. In using the capture-mark-recapture technique, why is it important to take an average of several
recaptures rather than doing just a single recapture?
3. For the simple mark-recapture in Part 1, how did your initial guess of the population size compare
to the actual population number determined by a direct count?
4. For the simple mark-recapture in Part I, how did your calculated population estimate (N) compare
to the actual population number determined by a direct count?
5. For the repeated mark-recapture in Part II, how did your initial guess of the population size compare
to the actual population number determined by a direct count?
6. For the repeated mark-recapture in Part II, how did your calculated population estimate (N)
compare to the actual population number determined by a direct count?
7. Did the simple mark-recapture or the repeated mark-recapture provide the most accurate estimate
of population size (N),
8. What do you have to assume to be true in order to believe your estimates of population size? What
might happen in a real population of animals that would affect your results? (Give at least two
assumptions)
9. List three additional populations for which the Mark-Recapture technique would work well.
10. List three populations for which the Mark-Recapture technique would not work well.
(R
No
11. Using the quadrat technique you calculated a series of population samples from two different
locations. Is the mean number of acorns the same for both locations? Do you think the difference is
simply the result of chance? Give reasons for your answer.
12. What would be the advantage of increasing the number of quadrats sampled? What would be
the disadvantage or cost of increasing this number?
13. How should you arrange quadrats to get the best possible estimates of population size/density?
14. List three additional populations for which the quadrat technique would work well.
15. List three populations for which this technique would not work well.
16. Complete the table using the information from your quadrat counts.
Mean density
Site A
Variance
Variance/Mean
Site B
17. Why did you think the organisms were living in this pattern?
Distribution Pattern
check_circle الجواب — حل مفصل خطوة بخطوة
hourglass_top
🔒
الحل الكامل متاح للمشتركين
اشترك في أرشيف الأسئلة لعرض هذا الحل وآلاف الحلول المفصلة خطوة بخطوة من معلمين معتمدين.