تم الحل ✓
categoryإحصاء
schoolبكالوريوس
event_available2026-07-14
السؤال
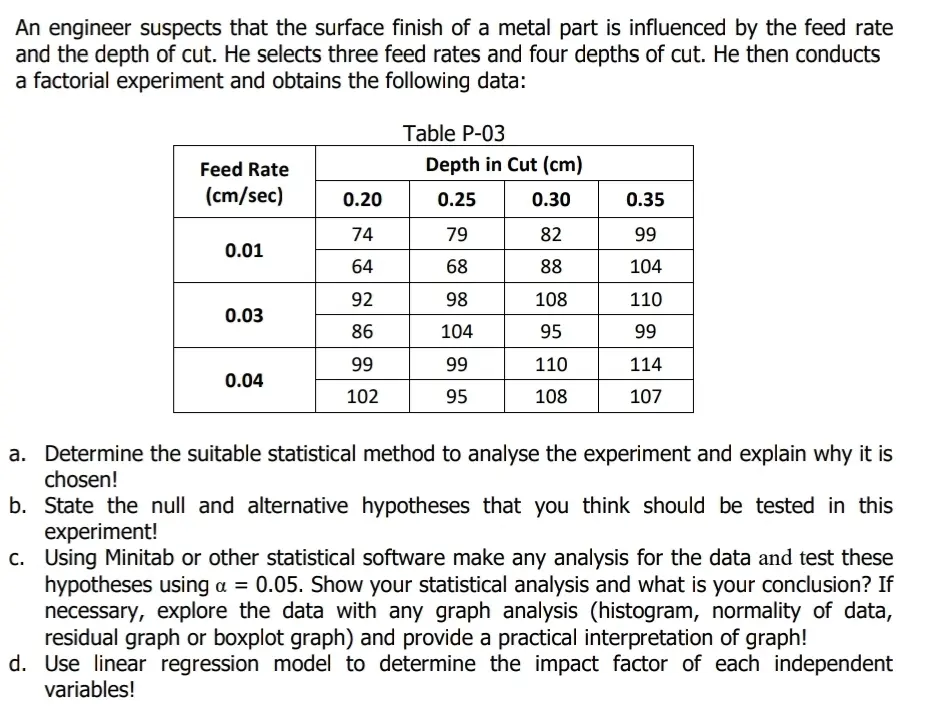
Transcribed Image Text:
An engineer suspects that the surface finish of a metal part is influenced by the feed rate
and the depth of cut. He selects three feed rates and four depths of cut. He then conducts
a factorial experiment and obtains the following data:
Table P-03
Feed Rate
(cm/sec)
Depth in Cut (cm)
0.20
0.25
0.30
0.35
74
79
82
99
0.01
64
68
88
104
92
98
108
110
0.03
86
104
95
99
99
99
110
114
0.04
102
95
108
107
a. Determine the suitable statistical method to analyse the experiment and explain why it is
chosen!
b. State the null and alternative hypotheses that you think should be tested in this
experiment!
c. Using Minitab or other statistical software make any analysis for the data and test these
hypotheses using α = 0.05. Show your statistical analysis and what is your conclusion? If
necessary, explore the data with any graph analysis (histogram, normality of data,
residual graph or boxplot graph) and provide a practical interpretation of graph!
d. Use linear regression model to determine the impact factor of each independent
variables!
check_circle الجواب — حل مفصل خطوة بخطوة
hourglass_top
🔒
الحل الكامل متاح للمشتركين
اشترك في أرشيف الأسئلة لعرض هذا الحل وآلاف الحلول المفصلة خطوة بخطوة من معلمين معتمدين.